


Bitcoin Reclaims $80,000 as Bulls Challenge Key Resistance
Bitcoin has entered the weekend with a very different setup from the one traders were watching only a few sessions ago. Instead of remaining trapped around the $77,000 area, BTC has pushed back above $80,000 and briefly traded above $82,000, putting the market’s attention firmly back on the resistance zone that has controlled the recent recovery. Current market data show Bitcoin around the $80,000–$81,000 area, while recent intraday trading reached approximately $82,000, giving bulls a chance to challenge levels that previously looked difficult to reclaim.
That move matters because Bitcoin’s short-term structure has changed quickly. Earlier in the week, the central question was whether buyers could defend $77,000 after the cryptocurrency repeatedly failed to hold above $80,000. Now the question is almost the reverse: can buyers keep BTC above $80,000 and turn that former resistance into support? The answer could determine whether the current rally develops into a broader recovery or becomes another short-lived breakout that attracts sellers.
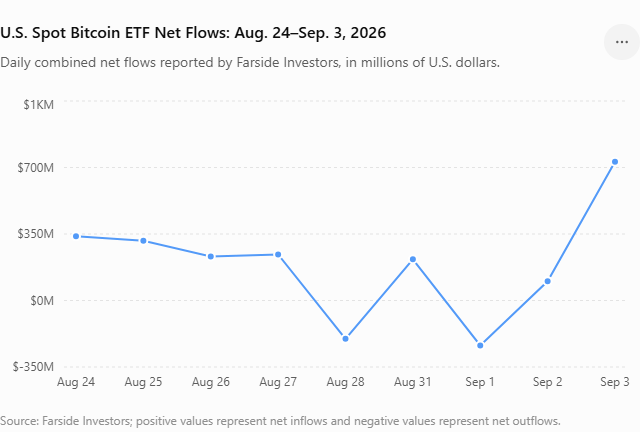
The market also has several moving parts behind the price action. U.S. spot Bitcoin ETF flows have swung sharply between inflows and outflows, macroeconomic expectations continue to influence risk assets, and derivatives positioning can amplify moves when Bitcoin approaches major technical levels. Farside’s latest data show a particularly strong $730.8 million net inflow on September 3, following a $101.1 million inflow on September 2 and a $236.5 million outflow on September 1.
So, what should traders and market observers watch now? The key levels are relatively clear. $80,000 is the immediate battleground, $82,000–$83,000 is the next major resistance region, and $77,000 remains an important downside reference if the recovery fails. The bigger story is whether Bitcoin can build acceptance above these levels rather than simply producing another temporary spike.
Bitcoin’s Latest Price Move
Bitcoin’s current move is significant because it follows a period of unusually sharp back-and-forth trading. At the start of September, BTC was struggling around the upper-$70,000 region, with $77,000 acting as an important short-term floor. Market analysis at the time identified the $77,000 area as a key level that could determine whether Bitcoin remained in consolidation or started another leg lower.
The recovery accelerated after Bitcoin spent time below $80,000. On September 3, BTC moved strongly through that psychological threshold, with reports showing an intraday high around $80,477 during the initial breakout. By September 4, Bitcoin had extended the move, reaching above $82,000 before pulling back modestly. Investing.com data showed Bitcoin around $80,938 with a daily range between approximately $80,673 and $81,429 at the time of its latest displayed update, while other market data recorded a move above $82,000.
That difference between the headline price and the intraday high is important. Crypto markets can move hundreds or even thousands of dollars within a short period, so a single price snapshot does not tell the whole story. Instead, traders need to watch whether BTC can repeatedly trade above a level and whether pullbacks are bought quickly. A breakout that survives several tests generally carries more technical significance than a brief move above resistance followed by an immediate reversal.
BTC Pushes Back Above $80,000
The $80,000 level has become one of the clearest psychological and technical markers in the current Bitcoin setup. Bitcoin’s earlier rejection above $81,000 left $80,000 acting as resistance, and the subsequent recovery created a situation where the same number could now become support. This is a classic example of how market psychology works: a level that sellers previously defended can become a level buyers are determined to protect after a breakout.
The recent move has also improved Bitcoin’s short-term technical structure. Reuters reported that Bitcoin’s latest rally pushed the cryptocurrency above several important moving averages, including the 21-day, 55-day, 100-day and 200-day averages, while the 21-day average produced a bullish crossover pattern. Reuters also identified $82,793 near the May high as an important resistance area.
That does not guarantee another rally, of course. Technical markets rarely move in straight lines, especially when price approaches an established resistance area. Instead, the important question is whether Bitcoin can consolidate above $80,000 without giving sellers enough momentum to force a return toward the mid-$70,000s.
Why the $82,000 Area Matters
The $82,000–$83,000 region is becoming increasingly important because it combines recent trading highs with a broader technical resistance area. Reuters highlighted a May high around $82,793, describing it as an important barrier that aligns with the 61.8% Fibonacci retracement and longer-term technical measures. A decisive break above that region could therefore have considerably more meaning than simply crossing the round-number $80,000 level.
Think of $80,000 as the front door and $82,000–$83,000 as the main gate. Bitcoin can walk through the first door, but it still needs enough momentum to get through the second barrier. If buyers succeed, the technical picture could become considerably stronger because the market would have cleared a series of nearby resistance points instead of merely touching one psychological number.
The next major upside area would then depend on how the breakout develops. Reuters noted that a sustained move above its resistance zone could open the possibility of a move toward $90,000, although that should be viewed as a scenario rather than a guaranteed target.
Bitcoin’s Key Support and Resistance Levels
The current Bitcoin chart can be understood through a handful of levels rather than dozens of individual numbers. Traders often become distracted by every small price movement, but the broader structure is easier to read when the market is divided into support, resistance and breakout zones. For BTC, the most important areas currently sit around $77,000, $80,000 and $82,000–$83,000, with deeper support becoming relevant if the recovery breaks down.
| Bitcoin Level | Market Role | What Traders Are Watching |
|---|---|---|
| $82,000–$83,000 | Major resistance | Whether BTC can establish a clean breakout |
| $81,000–$82,000 | Near-term resistance | Continuation above recent highs |
| $80,000 | Psychological pivot | Whether resistance becomes support |
| $77,000–$78,000 | Important support | Whether buyers defend the recovery |
| $75,000–$75,500 | Secondary support | Potential downside target after $77K fails |
| $71,700–$72,000 | Major structural area | Deeper support if selling accelerates |
The $77,000 Support Zone
The $77,000 region remains relevant even after Bitcoin’s latest recovery. Before the latest rally, BTC had repeatedly interacted with that area, making it a reference point for buyers and sellers. Market analysis earlier in the week identified approximately $77,165 as critical short-term support, while the broader technical picture also placed the mid-$75,000s below it.
Why does this level still matter after Bitcoin has moved above $80,000? Because successful breakouts are often tested. If BTC pulls back toward $80,000 and buyers step in, the market can demonstrate that the old resistance has become new support. If instead Bitcoin loses $80,000 quickly and continues toward $77,000, the market would begin questioning whether the breakout was sustainable.
A break below $77,000 would not automatically mean that Bitcoin’s larger trend has collapsed, but it would weaken the short-term bullish setup. The next areas could then include $75,000–$75,500, followed by deeper support around $72,000. Reuters has separately identified $75,674 and $71,781 as important downside levels in the broader technical structure.
The $80,000 Breakout Level
The psychological importance of $80,000 should not be underestimated. Round numbers attract attention because they are easy for traders, media outlets and investors to remember. When a market repeatedly fails at such a level, it can become a magnet for selling pressure; when the market finally breaks through, the same number can become a reference point for buyers.
Bitcoin’s move through $80,000 was particularly interesting because the cryptocurrency had spent much of the previous period struggling to maintain momentum around that region. The September 3 rally therefore represented more than a small technical bounce. It showed that buyers were willing to absorb selling pressure around a level that had recently rejected price.
The real test now comes during pullbacks. A market does not prove a breakout simply by moving above resistance. It proves it by holding the breakout zone when sellers return. If Bitcoin can remain above $80,000 while trading volume and institutional demand stay supportive, the bullish interpretation becomes stronger.
The $82,000–$83,000 Resistance Zone
Above $80,000, the market faces a much more substantial challenge. The $82,000–$83,000 area contains recent highs and the May resistance highlighted by Reuters. Bitcoin’s recent intraday move above $82,000 shows that buyers are already testing the region, but trading above it briefly is different from closing and consolidating above it.
If BTC breaks through $82,793 and holds that area during subsequent retests, technical traders could interpret the move as confirmation that the recovery has moved into a stronger phase. On the other hand, repeated failures around $82,000–$83,000 could produce another rejection and send BTC back toward $80,000.
This is why the next few sessions could be more important than the initial breakout itself. The market has already demonstrated that it can move above $80,000. Now it needs to demonstrate that it can stay there and absorb profit-taking.