


Bitcoin and Ethereum ETFs Attract Nearly $900 Million as BTC Breaks Above $81,000
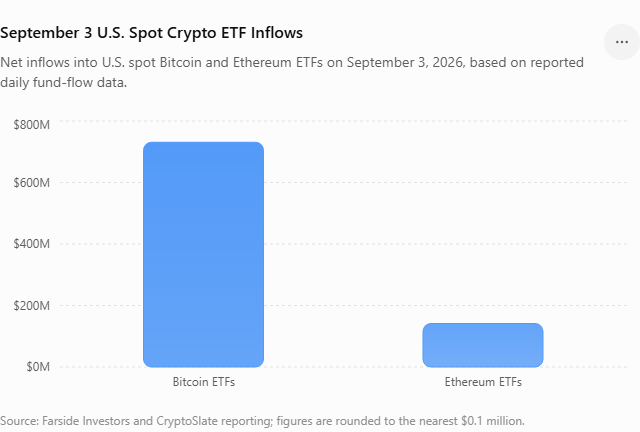
Bitcoin and Ethereum have started September with renewed momentum as U.S. spot exchange-traded funds recorded a combined $872.2 million in net inflows on September 3, according to the latest reporting. Bitcoin ETFs accounted for the overwhelming majority of the capital, attracting $730.8 million, while Ethereum ETFs collected approximately $141.4 million. At the same time, Bitcoin climbed above $81,000, while Ethereum moved beyond $2,500, giving the cryptocurrency market a much-needed burst of confidence after a volatile stretch.
The significance of the move goes beyond the headline numbers. ETF inflows represent actual investment demand for exchange-traded products, while the price rally itself was also helped by traders closing bearish positions. According to reporting from CryptoSlate, Bitcoin futures open interest climbed above $57 billion, while more than $260 million in short positions were liquidated during the advance. That combination creates an interesting market structure: fresh spot demand is arriving at the same time that leveraged traders are being forced to buy back positions.
For investors watching the crypto market, the key question is whether this represents the beginning of a sustained accumulation phase or simply another sharp rally inside a volatile market. Bitcoin has already demonstrated that it can recover rapidly when sentiment changes, but elevated leverage can also make rallies fragile. Ethereum faces a similar test, particularly after its ETF flows reversed from an outflow on September 2 to a substantial inflow the following day.
Bitcoin Breaks Above $81,000
Bitcoin’s move above $81,000 has become the most visible sign that buyers are regaining control of the short-term market. The cryptocurrency had previously struggled around the $77,000–$80,000 region, so pushing beyond $81,000 represents a meaningful change in momentum. On September 4, Bitcoin briefly climbed as high as approximately $82,164, its strongest intraday level since May, before pulling back modestly.
The rally was particularly notable because Bitcoin started the week close to the $77,000 area. A move of several thousand dollars in only a few sessions shows just how quickly sentiment can change in cryptocurrency markets. Once BTC began moving higher, short sellers were forced to close positions, adding another layer of buying pressure to the underlying spot demand. This creates a snowball effect in which a modest initial move can become much larger as leveraged traders scramble to adjust their positions.
Current market data therefore present a more constructive picture than they did earlier in the week, but the rally still needs confirmation. A brief move above $81,000 is one thing; establishing support above $80,000 and eventually clearing the $82,000–$83,000 region would be much stronger evidence that buyers have taken control. Traders should therefore focus less on one hourly price spike and more on whether Bitcoin can maintain higher lows after the breakout.
Why $80,000 Became a Critical Bitcoin Level
The $80,000 level has become a psychological dividing line for Bitcoin. Round numbers naturally attract attention, but this particular level has also acted as an important area of resistance during the recent trading range. When BTC was unable to hold above it, sellers repeatedly pushed the price lower, creating uncertainty about whether the market could recover.
Now the situation is changing. Bitcoin has moved back above $80,000, which means traders are watching to see whether the former resistance becomes support. This is a common feature of technical markets: once buyers finally overcome a major barrier, they often need to defend that same area during the next pullback.
The latest rally gives bulls an opportunity to prove that the market has genuinely shifted. If BTC falls toward $80,000 but buyers quickly step in, that would provide stronger confirmation than another temporary spike toward $82,000. If Bitcoin instead loses $80,000 immediately and starts moving back toward $77,000, the recent breakout could begin looking more like a failed move.
Ethereum Moves Above $2,500
Ethereum has also joined the recovery, with ETH moving above $2,500 as institutional demand returned to its spot ETF products. The move is important because Ethereum had experienced a brief interruption in its ETF inflow streak immediately before the latest surge. CryptoSlate reported that Ethereum ETFs saw approximately $48.2 million of net outflows on September 2, ending a 12-session inflow streak, before reversing with $141.4 million of inflows on September 3.
That reversal shows how quickly institutional positioning can change. One day of outflows does not necessarily mean investors have abandoned Ethereum, just as one day of inflows does not prove that a permanent accumulation cycle has begun. What matters is whether the market can sustain positive flows while ETH holds above important technical levels.
Ethereum’s performance is also relevant because it demonstrates that the latest crypto rally is not limited entirely to Bitcoin. When capital begins flowing into both BTC and ETH ETFs at the same time, it can indicate broader institutional interest in digital assets rather than a single-asset trade. That broader participation can make a market move more durable, although it does not remove the risk of sudden reversals.
ETH ETF Demand Rebounds
Ethereum’s ETF recovery was particularly concentrated. BlackRock’s ETHA and Fidelity’s FETH attracted a combined $137.2 million, accounting for almost the entire category’s net inflow on September 3, according to CryptoSlate. That concentration shows how strongly investor demand can be focused on the largest and most established products.
For Ethereum bulls, continued ETF demand would provide an important source of support. Spot ETF purchases can create demand that is separate from short-term speculative trading, giving the market a deeper pool of potential buyers. If ETH can continue attracting capital while remaining above $2,500, traders may begin treating that level as an important new support zone.
The immediate technical challenge is therefore not simply reaching $2,500. Ethereum needs to demonstrate that buyers are willing to defend the area after the initial excitement fades. If that happens, higher resistance levels could come into focus. If the price quickly drops back below $2,500, however, the latest move could prove to be another momentum-driven rally rather than a lasting trend reversal.
Nearly $900 Million Flows Into Crypto ETFs
The combined $872.2 million inflow into U.S. spot Bitcoin and Ethereum ETFs on September 3 is the central statistic behind the latest market rally. Bitcoin contributed $730.8 million, while Ethereum added $141.4 million, creating one of the strongest single-day institutional demand signals seen during the recent recovery.
What makes the number especially interesting is its timing. Bitcoin and Ethereum had both experienced uneven trading and changing ETF flows during the preceding sessions. Bitcoin ETFs moved from a $236.5 million outflow on September 1 to a $101.1 million inflow on September 2 before the massive $730.8 million inflow on September 3. Farside’s daily data confirms those figures and shows that BlackRock’s IBIT alone recorded approximately $454 million of inflows on September 3.
This pattern suggests that institutional sentiment can change rapidly when macroeconomic expectations and cryptocurrency momentum align. The key question now is whether the September 3 inflow represents a one-day burst or the beginning of a sequence of strong inflows. If capital continues entering the products, the latest rally could receive a stronger foundation; if flows reverse sharply, traders may question whether the move was mostly driven by short covering.
BlackRock Leads Bitcoin ETF Demand
BlackRock’s IBIT was the clear leader among Bitcoin ETFs on September 3, attracting approximately $454 million. That represented roughly 62% of the day’s total Bitcoin ETF inflow, making IBIT the dominant destination for the fresh capital. ARK 21Shares’ ARKB followed with approximately $137.7 million, while Fidelity’s FBTC collected about $74.4 million.
The concentration is significant because large ETF products have become major channels through which traditional investors can gain Bitcoin exposure. Strong flows into the biggest funds can therefore influence market sentiment beyond the ETF market itself. Traders watching the underlying asset often interpret persistent institutional buying as a sign that larger investors are willing to absorb available supply.
Still, one should avoid treating IBIT’s strong inflow as a guaranteed signal that Bitcoin must rise. ETF flows can change quickly, and investors can move capital in response to prices, economic data and risk conditions. The better signal is a sustained pattern in which strong inflows continue while Bitcoin builds a higher price structure.
Fidelity and ARK 21Shares Also Attract Capital
The participation of ARKB and FBTC provides another useful piece of the puzzle. While BlackRock dominated the day’s flow, other major funds also recorded meaningful inflows, suggesting the demand was not isolated to a single ETF issuer. That broader participation can be more encouraging than a situation where one product receives almost all of the day’s capital.
The combined flow also shows why ETF data are increasingly relevant to Bitcoin analysis. Instead of looking only at exchange trading volume or futures positioning, market participants can now watch regulated investment products to understand whether traditional capital is moving toward or away from the asset.
The trend becomes especially useful when ETF flows and price action agree. Rising prices alongside strong inflows generally provide a more constructive signal than rising prices alongside heavy outflows. Conversely, if Bitcoin rallies while ETFs experience persistent redemptions, traders may wonder whether the move is being driven primarily by leverage rather than genuine spot demand.
Bitcoin ETF Flows Signal Fresh Institutional Demand
The latest inflows offer evidence that institutional interest has returned after a period of uncertainty. Farside’s data show a dramatic shift from the $236.5 million outflow on September 1 to $101.1 million of inflows on September 2 and then $730.8 million on September 3. That is a substantial three-session swing and illustrates just how quickly capital can return when market sentiment changes.
The important word here is demand. Short covering can push Bitcoin higher, but ETF purchases represent a different market force because the funds provide exposure through spot-backed investment vehicles. When large inflows coincide with a price breakout, they can help absorb selling pressure that might otherwise stop the rally.
Simon-Peter Massabni of XS.com told CryptoSlate that flows of this size absorbed substantial sell orders and helped lift spot prices despite higher sovereign bond yields in the United States and Japan. His comments underline the significance of the flow data, although market participants should still consider ETF flows alongside broader macroeconomic conditions rather than treating them as a standalone predictor.